In addition to the piecewise cubic curve drawing routines, GINO provides two routines to draw a smooth curve through a series of points using cubic splines:
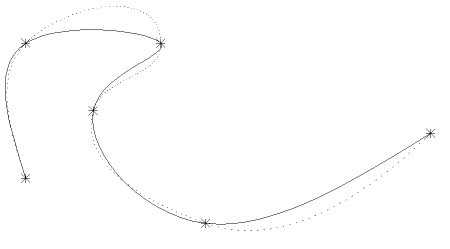
gDrawSplineTo2D(npts, points2, beg, fin)In comparison to the piecewise cubic curve routines, the spline curves are generally tighter than the gDrawCurveTo2D()/gDrawCurveBy2D() set and are more accurate at fitting functional data than the gDrawAkimaTo2D()/ gDrawAkimaBy2D() set. For example, using the same six points set up in the previous example, gDrawCurveTo2D() (in dotted line) and gDrawSplineTo2D() (in solid line) give the following output with no end conditions set:
 |
Comparison of spline with curve output |
The routine gSetArcIncrement() controls the number of increments between each supplied data point.
End conditions can also be set for spline curves in the same way as for piecewise cubic curves, but it is usually necessary to set angular end conditions using scaled derivatives instead of simply sines and cosines.
For monotonically increasing data in either X or Y or Z, these can easily be calculated, or it is sufficient to set the X slope to 1.0 and the Y slope to y'(x) and the drawing routines will compute the correct value. For parametric data, estimates for the actual gradient (x'(t), y'(t)) are really required. End conditions can alternatively be set using an extra point in 2 or 3 dimensions in the same manner as the previous curve routines.
The routines gSetCurveAttribs2D()/gEnqCurveAttribs2D() are used to set and enquire the end conditions for 2D spline curves, and an additional pair of routines are used for the 3D equivalent function. Thus:
gSetCurveAttribs2D(dxbeg,dybeg,dxfin,dyfin,xbeg,ybeg,xfin,yfin)An alternative approach to smoothing is to use a spline in tension. The routines gSetSplineTension() and gEnqSplineTension() are used to set and enquire the current spline tension value which has a default of 0.0.
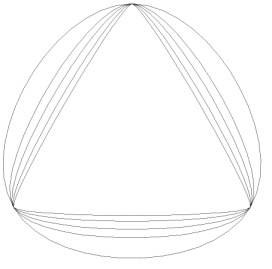
gSetSplineTension(ten)As the value of ten increases, the curve moves closer to a polyline representing the supplied data points, with ultimate loss of smoothness. Values in the range 0 to 10 give reasonable results and it is also possible to use negative values down to -2 to give a more rounded shape to the curve. The curves in the diagram below show the effect of applying tension to a circle generated from 3 data points.
 |
Spline Curve Tension |